Google Analytics 4
Google Analytics 4 is an analytics service that enables users to measure traffic and engagement across websites and apps. Google Analytics 4 collects data through data streams, users can create iOS app, Android app and web data streams on a single property.
GA4 collects the following information through the default implementation:
- Number of users
- Session statistics
- Approximate geolocation
- Browser and device information
Home
The Home page is used to monitor traffic, navigate around Analytics, and get insights about the websites and mobile apps. It provides more personalized content as users continue to use Analytics.
The home page reveals snapshots of various metrics and real-time number of users in the last 30 minutes (per minute) with up to 5 countries from which the activity originates.
Reports
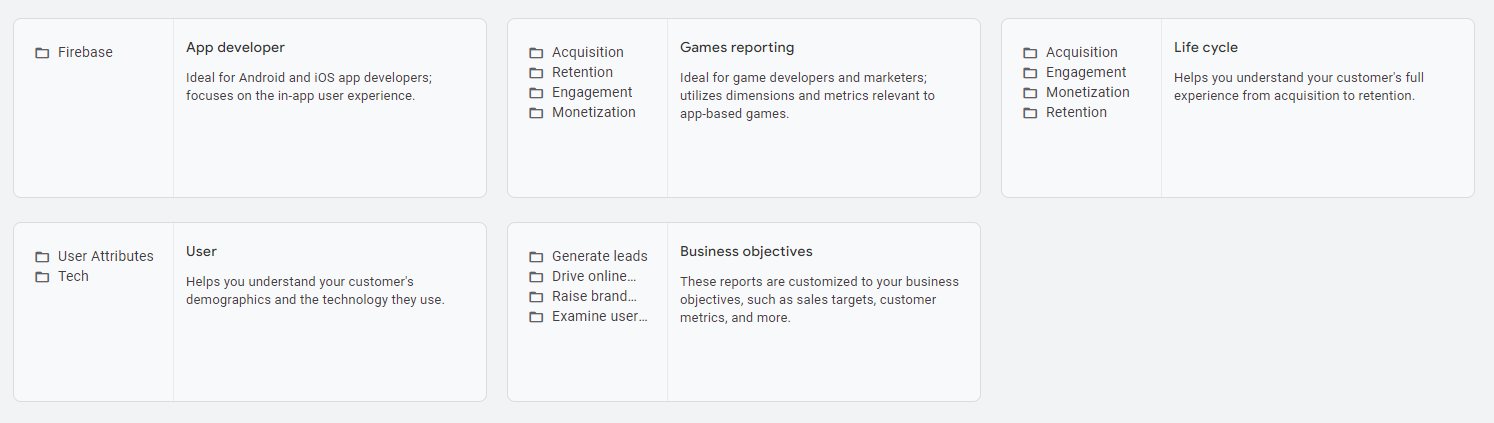
The reports page contains various types of reports under collections such as app developer, games reporting, life cycle, user and business objectives collection.
Besides default Google Analytics 4 reports, users also can create custom reports based on their reporting needs and add their customized reports to collections.
Explore
Explorations is a collection of advanced techniques that go beyond standard reports to help users uncover deeper insights about customer behavior.
Explorations can be used for:
- quickly perform ad hoc queries
- easily configure and switch between techniques
- sort, refactor, and drill down into the data
- focus on the most relevant data by using filters and segments
- create segments and audiences
- share explorations with other users of the same Google Analytics property
- export the exploration data for use in other tools
Explore consists of the following exploration techniques:
- Free-form exploration
- Cohort exploration
- Funnel exploration
- Segment overlap
- User exploration
- Path exploration
- User lifetime
Advertising
The reports in this section help users to better understand the ROI of the media spend across all channels, make informed decisions about budget allocation, and evaluate attribution models.
There are currently 4 reports in the Advertising section:
- Advertising snapshot: Presents a quick overview of business metrics.
- Performance: Revelas which channels and campaigns received conversion credit.
- Model comparison: Comparison of how different attribution models impact the valuation of marketing channels.
- Conversion paths: Shows customers’ paths to conversion and how different attribution models distribute credit on those paths.
Common Google Analytics 4 metrics
New User
The number of new unique user IDs that logged the first_open or first_visit event. This metric allows users to measure the number of users who interacted with the web site or launched the app for the first time.
Returning Users
The number of users who have initiated at least one previous session, regardless of whether or not the previous sessions were engaged sessions.
Total Users
The number of unique user IDs that triggered any events. The metric allows users to measure the number of unique users who logged an event.
Active Users (Users)
The number of distinct users who visited the website or application. An active user is any user who has an engaged session or when Analytics collects:
- the first_visit event or engagement_time_msec parameter from a website
- the first_open event or engagement_time_msec parameter from an Android app
- the first_open or user_engagement event from an iOS app
Note: The Active users metric appears as "Users" in Reports.
Sessions
A session is a period of time during which a user interacts with the website or app. A session initiates when a user either:
- Opens the app in the foreground
- Views a page or screen and no session is currently active (e.g. their previous session has timed out)
By default, a session ends (times out) after 30 minutes of user inactivity. There is no limit to how long a session can last.
Average Session Duration
The average duration (in seconds) of users' sessions.
Bounce Rate
The percentage of sessions that were not engaged sessions.
- Bounce rate = not engaged sessions / total sessions
Bounce rate is the inverse of engagement rate.
Engagement Rate
The percentage of sessions that were engaged sessions. Learn more
- Engagement rate = engaged sessions / total sessions
Engagement rate is the inverse of bounce rate.
Engaged Sessions
The number of sessions that lasted 10 seconds or longer, or had 1 or more conversion events or 2 or more page or screen views.
Average Session Duration
The average duration (in seconds) of users' sessions.
Views
The number of mobile app screens or web pages users saw. Repeated views of a single screen or page are counted.
Views per Session
The number of app screens or web pages users viewed per session. Repeated views of a single page or screen are counted.
- Views per session = (screen_view events + page_view events) / total sessions
Conversions
The number of times users triggered a conversion event.
For more information and training requests, please kindly contact Büşra Önbas (bonbas@ku.edu.tr).